

Regardless of the model, I am confident that many advisors simply do not understand nor take the time to research the underpinnings of the investments they are recommending to clients.

This is especially true during a raging bull market where a collection of cheap, passive and predominately large cap growth funds can outperform just about any other investment. Trends don’t last forever, and the investment landscape is cyclical with investment asset classes routinely coming in and out of favor. Trends can last a couple of months, years, or even decades.
I think it’s vital for everyone to know “what’s in my investment” and this doesn’t just mean being able to recite the list of stocks or funds but understanding the underlying constituents of those investments.
Active Mutual Funds
It’s quite difficult to get a true representation of mutual fund holdings since they are released on a quarterly basis. A true active fund will likely make quite a bit of trades during the quarter. However, from my experience, following the quarterly changes will give you a good idea of the managers mindset and how often they rotate out holdings.
We use Ycharts for our fund research and have a process in place to routinely monitor the underlying fund holdings. While I agree that when hiring an active manager, you are outsourcing the stock selection, it’s still important to be educated on what makes up the portfolio.
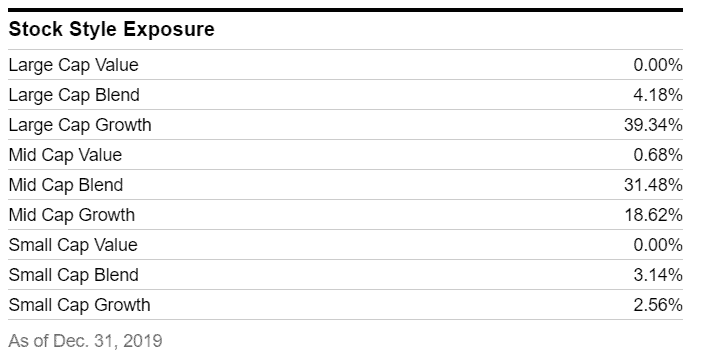
Let’s look at a great example of why this is important. The Baron’s Partner Fund (BPTRX) is listed as a Mid Cap Growth fund. The classification system is flawed at best given the difficulty of trying to pigeonhole a truly active fund.
Regardless, I would gather that most investors who are allocating to a Mid Cap Growth fund would prefer to be invested in a Mid Cap Growth fund. However, this fund only owns 18.62% of Mid Cap Growth stocks with a whopping 39.34% allocated to Large Cap Growth according to the 12/31/19 Stock Style Exposure.
There is nothing inherently wrong with style drift, but it supports the concept that advisors should understand their investment recommendations – so there are not any surprises.
But this is just the tip of the iceberg because there are some data points that are never going to be collected by any analytical software. The best way to intimately understand a fund is to read the prospectus; you know that pesky document that no investor or advisor in the history of mankind has ever read.
If you decided to read the prospectus of the same Barons Partners Fund mentioned above you would find one line of language that will never be reflected in any research software system.
“As noted earlier in the Prospectus, Baron Partners Fund may borrow money from banks to take advantage of opportunities to invest (leverage) in an amount up to one-third of its total assets, which include assets purchased with borrowed money.”
Translation: This fund can use leverage to have a 133% exposure to the stock market at any given time.
There are a ton of Broker Dealers and RIA’s that ban their advisors from using leverage because they think it can’t be used responsibly. I will bet every dollar I own that this exact fund is also available on the platforms of those very same firms.
Why? Because no one bothers to do the real due diligence to understand investments and merely participate in a high-level-only process to cover their own ass.
There is nothing inherently wrong with leverage, but it supports the concept that advisors should understand their investment recommendations – so there are not any surprises.
Passive Funds and ETFs
The chances are high that most advisors have owned or recommended a passive index fund and most recommendations are based on the popular S&P 500. In fact, the top five mutual funds, in terms of AUM, are all variations of Large Cap Blend.
Because of how the index is weighted in terms of market cap it will eventually tilt heavily towards the largest mega cap stocks. At times, like today, that over-concentration gets a little bit out of control.
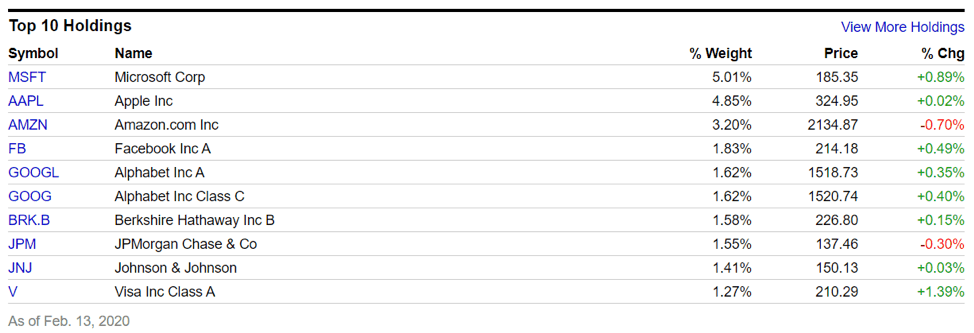
Let’s look at the holdings for the popular SPY ETF that tracks the S&P 500. Today two stocks make up 10% of the S&P 500 Index weighting and five stocks account for nearly 20%. These five stocks are the technology heavy Microsoft, Apple, Amazon, Facebook, and Google.
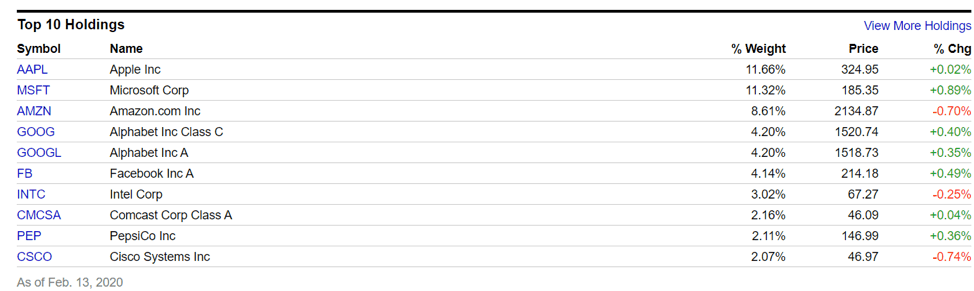
This concentration exponentially increases when looking at the Nasdaq 100 and its popular ETF wrapper the Q’s: QQQ. These same five stocks make up an astonishing 44% of this index!
These are some of the best technology companies in the world, who are extremely profitable, and changing the world. But risk is risk, and these stocks sure don’t disappoint when it comes to their levels of downside pain.
Our favorite risk measurement tool vis maximum drawdown, which shows a true measure of how much actual loss of capital an investor can handle.

There is nothing inherently wrong with aggressive technology stocks, but it supports the concept that advisors should understand their investment recommendations – so there are not any surprises.
Conclusion
I know, I know. Shut up and crawl back into your risk management hole. Buy and hold cheap passive forever, etc. etc.

Diversifying your trading strategies will be every investors’ best bet in the years ahead.
Happy investing…
If you are curious about the best way to discuss risk with your clients, we created a free tool that you can white label with your own branding. Click the link below the fold to get your free tool today!