

I think one of the biggest misconceptions about risk management is you must permanently choose a side between risk-on and risk-off.
That’s simply not the case.
There is an abundance of investment products that can adjust their underlying risk levels, based on the current market environment.
It is a fact that most of the worst market days happen in down trending markets. But no, this does not mean an investment manager is going to pick market tops and bottoms exactly. That is absurd (and only possible with a hypothetical back test).
However, there are plenty of skilled managers that more than capable of dialing up or down the underlying risk levels of their portfolios. It’s not perfect, but is designed to smooth out the volatility in both the upside and downside.

Risk Management Comes in Many Flavors
Every investment manager has a different definition of risk management, but it will typically look like one of the following:
- Periodically create small amounts of cash.
- Stay invested, but asset allocate to take advantage of low volatility sectors or asset classes.
- Utilize fixed income to temper equity volatility.
- Actively rotate among cash, equities, and fixed income without constraints.
At Potomac, risk management all comes down to the mitigation and avoidance of catastrophic market losses. These are the market losses that can be devastating for investors approaching retirement (where the need for income is at its highest).
The Math of Risk Management
Americans are not good at math. Yeah I said it, the stats consistently prove this. This could be why risk management is so misunderstood in the investing world.
My favorite tool to use when discussing the math of advances and declines is also the simplest.
I am sure every advisor has seen this table below by now, but it rather eloquently illustrates how much return you need to generate to breakeven.
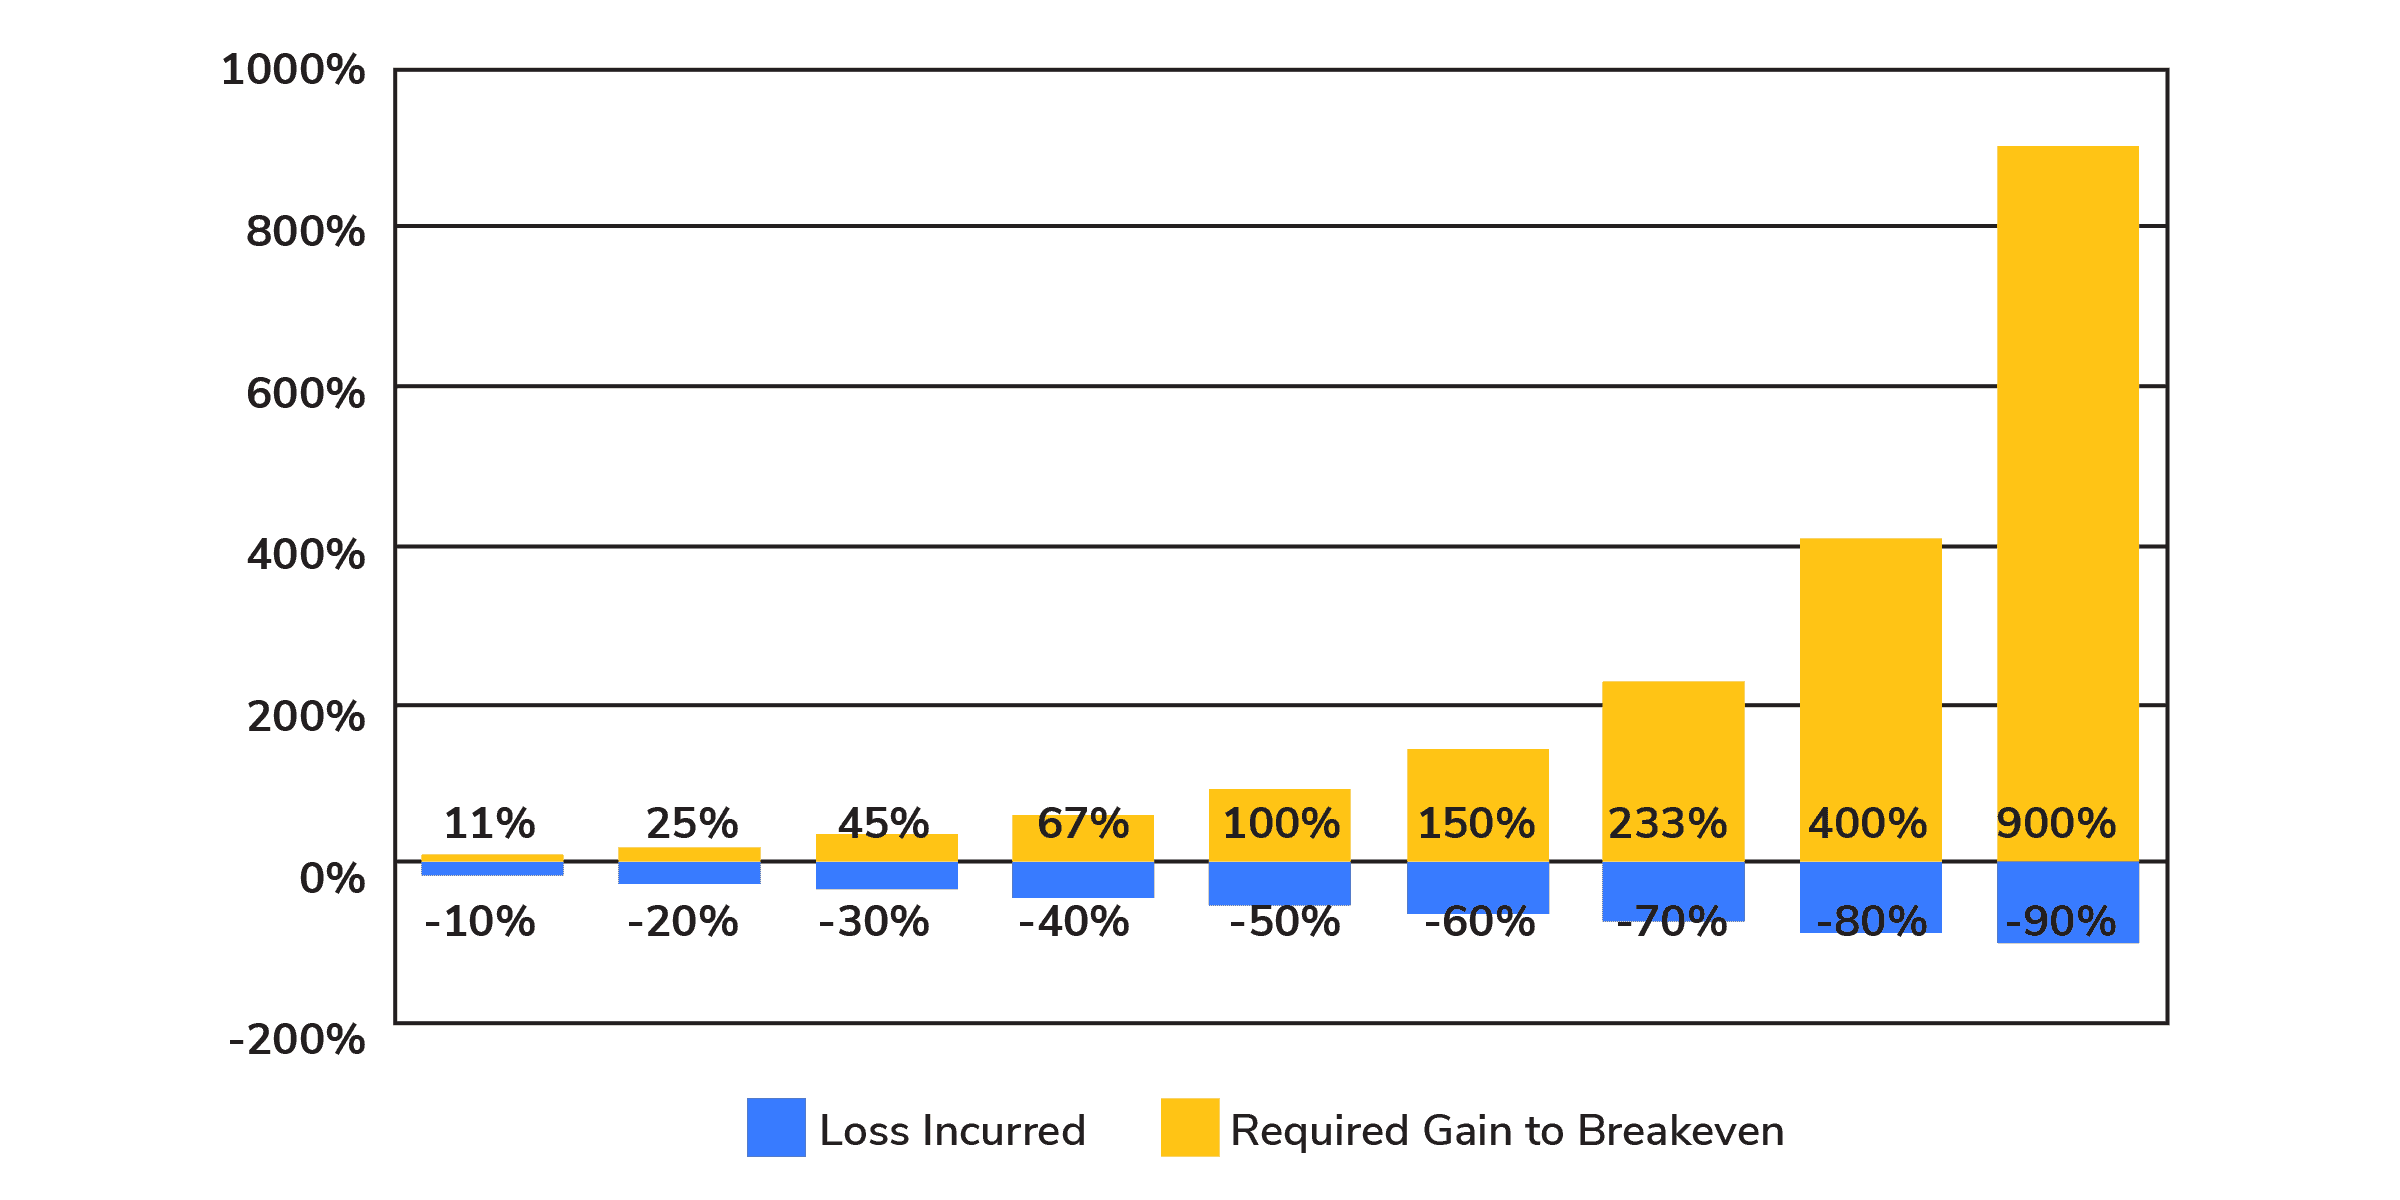
Regardless of how you feel about this table, the math doesn’t change. And that is the hardest thing for folks to grasp.
As I write this, I have had numerous people tell me that the most recent 2020 bear market decline of roughly -30% on the S&P 500 is “no big deal” because they made 30% last year so it’s a wash. What?!
Let’s work this math out in simple terms.
Your client starts with a $100,000 investment last year and hypothetically made a 30% return in 2019, ending the year at $130,000. Then the same client is now down -30% in 2020, so $130,000-$39,000 (-30%) is $91,000 and not the $100,000 breakeven.
This is the furthest thing from a “wash” and the client is now down roughly -10% from their initial investment.
The Bat Signal for Risk Management
Hands down the absolute best measurement of risk is maximum drawdown, which we talked about here.
To recap, maximum drawdown measures the peak to trough decline of an investment since its inception and is important for two primary reasons:
- First, maximum drawdown is easy for investors to understand—it’s all about how much pain you are willing to endure to seek returns.
- Second, maximum drawdown can’t be changed, obscured, hidden or beautified by other performance statistics. With any peak-to-trough drop in investment value, what you see is what you get. There’s no hiding or smoothing over the consequences of a significant loss.
Unfortunately, many investment products don’t report this number for fear of investors seeing such a large negative number and get spooked.
In plain terms the standard deviation is simply a measure of how far spread out numbers are from the mean. For standard deviation to mean anything there is an enormous assumption that an investment follows a normal distribution.

Do you know what risk statistic never changes no matter how good the rest of your returns are? Maximum Drawdown!
Conclusion
The way people manage risk is very personal to their situation. Just like in life, everyone’s personal situation determines their level of risk aversion.
For Potomac, it’s quite simple. Even though a roller coaster ends up at the same place… if you take out the large peaks and valleys you are less likely to barf on yourself along the way.
Happy Investing!

Disclosure: This information is prepared for general information only and should not be considered as individual investment advice nor as a solicitation to buy or offer to sell any securities. This material does not constitute any representation as to the suitability or appropriateness of any investment advisory program or security. Please visit our FULL DISCLOSURE page.